

What you need to know for Monday 5/18/2020
What you need to know for Monday 5/18/2020
Lets review everything and make a game plan.

Tl;dr - Bullish For Monday.

Let me gloat before we start!
On Friday, I broke my daily profit record…… BY DOUBLE.
Followed the momentum downwards with $GE shorts and $GS Shorts.
Called the reversal (Thur/Fri) and rode $SPY calls up.
A perfect week.
Didn’t lose a single day, and only had 1 bad trade with $TDOC Which I will be revenge trading despite everyone telling me not to. I’m not a bitch. I’m going to make TDOC my bitch.
Now for what you came for.
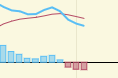
Let’s take a quick look at the weekly $SPY:
That single red candle stick doesn’t look like anything to be scared of. If you looked at just these candles, you would call this week healthy pullback. We can’t predict the future, but a single red candle like this is nothing to be concerned about (yet).
**Visualization exercise**
If you didn’t know anything about the market and just saw this:

Does it look bullish or bearish? Bullish is the correct answer.
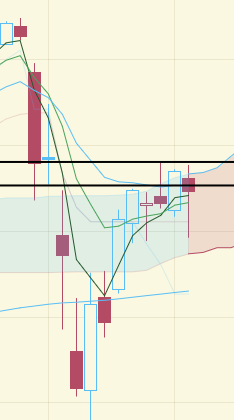
Now lets move onto the daily $SPY:
Notice we’ve spent almost no time in the bottom half of the range?
To me that signals strength. The early time we spent there was on the way up + healthy pullback. The second most recent time was because of two days of bad news.
It looks like we can only hit the bottom half of the range with a catalyst. And if you ask me, the next catalyst is going to be being denied at the top of the range again.
For now,
The daily chart looks extremely bullish to me.
“But what about the daily $SPY MACD cross?!?!”
Well, I don’t count it as one. We only got it because of bad news. It’s not the same as if price action caused it to cross by itself naturally. I’m ignoring it completely.
Conclusion:
Business as usual. Very bullish until spy hits the top of the range and tests 300 / 200MA. Then I’ll be back to being a bear.
Longs I’m Looking at:
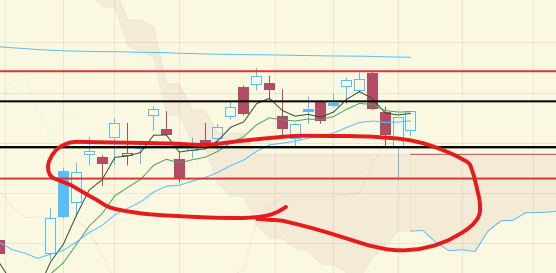
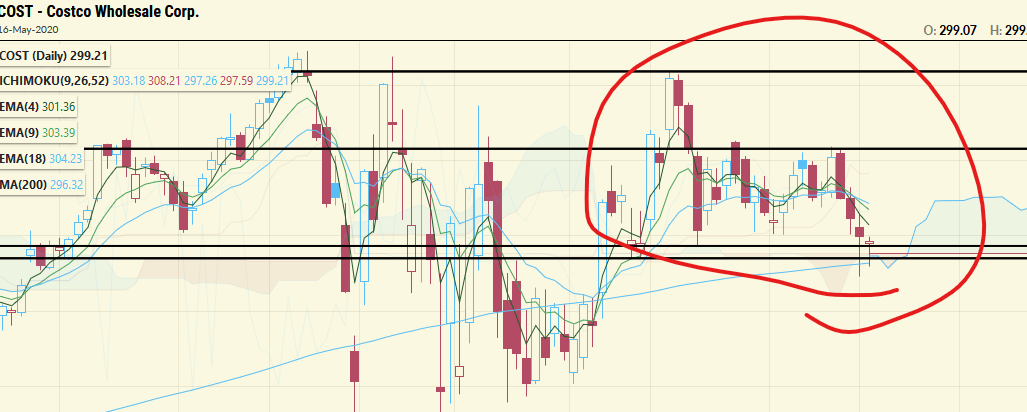
$COST - CostCo
(Daily Chart)
It’s at the bottom of its daily range and has A LOT OF UPSIDE. For not a lot of risk. I love this so much, it will be my #1 trade this week if this support holds which I’m betting it does.
I can’t emphasize enough how much I love this setup.
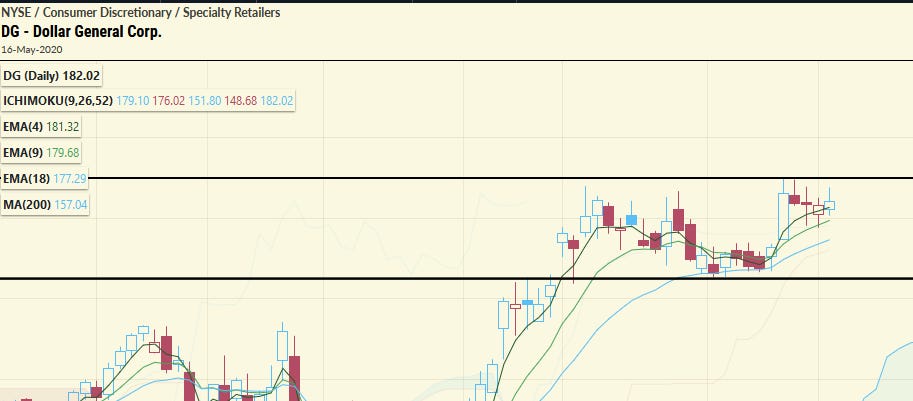
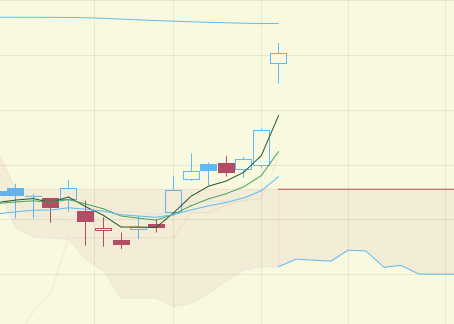
$DG - Dollar General
What’s impressing me about this is the strength you can see when the whole market is having giant losses. Look at those 2 days here. It held up strong. Looks to be setup to breakout again.
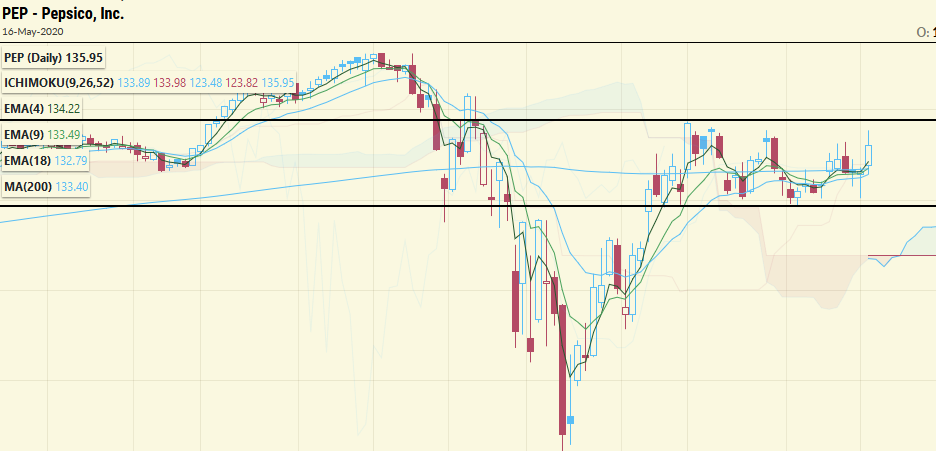
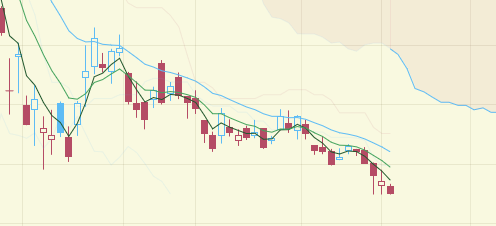
$PEP - Pepsi
Not 100% sold on this one. I almost deleted it 10x…But I do like it’s breakout potential.
The daily MACD just crossed bullish and look how well it held up through the two down days we had recently. That’s some strength being shown.
Side note:
$XLY -Consumer Discretionary Sector Fund
&
$XLP - Consumer Staples Sector Fund
Both sectors have a ton of holdings at the bottom of their ranges. They may be the biggest gainers this week since they have so much room to move.
Shorts:
Not looking at any because I’m that bullish right now - If the market goes down I’ll be shorting financials as always. Love you $GS
Trade Idea:
2 Week ($295 29th may) swing trade for $SPY
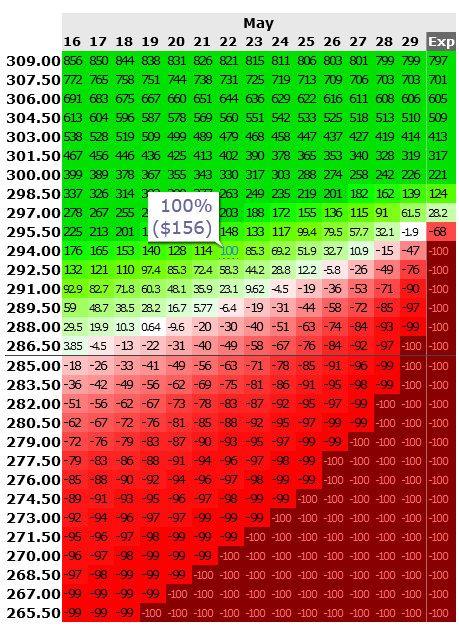
If you’re bullish, you set and forget. If it hits 294 by the end of this week, you’ll have 100% return. That seems very likely.
Also giving yourself another week for some safety. I’m really liking this idea. Will probably take a small swing position on it.
Also can you give me some credit?
Go back through my posts. Who did I call out long multiple times?
$SLV
Who did I call out to short multiple times?
$GE
WHO ELSE BE GIVING YOU THIS GOOD OF INFORMATION FOR FREE?!??
BEFORE IT WAS ON ANYONE’S RADAR!
AND I DON’T EVEN SELL ANYTHING!
Show me some love!

Daily Distractions
Been listening to this series on the Calm meditation app by Lebron James. Who better to teach you about mindset than a 3x champion? Tony Robbins? No thanks, I’ll listen to the champ himself.
It’s great.


I want to get this photo framed, paparazzi taking photos of Bill Clinton’s cat.
Just highlights the ridiculousness of “society”:

Fun Twitter thread:


The jam right now:
Disclaimer : This is not an investment advisory, and should not be used to make investment decisions. Information in Trade & Slayed is often opinionated and should be considered for information purposes only. No stock exchange anywhere has approved or disapproved of the information contained herein. There is no express or implied solicitation to buy or sell securities. The charts provided here are not meant for investment purposes and only serve as technical examples. Don't consider buying or selling any stock without conducting your own due diligence.